When Losers are Good Company
Posted by ludw1086 on Jan 14, 2013 in Blog | Comments Off on When Losers are Good CompanyA few years ago, when I helped create portfolios for retail customers, my research group considered offering customers the possibility to buy the worst performing stocks of the previous year. The logic is not too different from the Dogs of the Dow strategy. If you remember, the Dogs of the Dow strategy buys the highest dividend yielding stocks at the end of the calendar year and holds them for one year. Often times, these are stocks that had poor returns relative to other Dow stocks. The rationale for buying them could be that although they did poorly, the market overreacted and so there will be some kind of mean reversion and these stocks will do better in the following year. It could also be related to tax harvesting. That is, investors might sell loser stocks in December causing these stocks to decrease further in value than is truly necessary and they might rebound in the new year. Some people call this the January effect. With the worst performing stocks of a given year, this effect may be even greater. Investors don’t want to hold these stocks in their portfolio due to institutional constraints, causing the prices to decline much more than might be warranted from a fundamental valuation perspective. Overall, there might be several reasons that the “crowd” might have oversold these stocks.
If any of this is true, it could be a good strategy to buy the worst performing stocks of the previous year. In order to test this, we conducted a study from 1981 to 2010 and examined the following strategy.[1]
1. On December 31 of every year, sort all stocks in the U.S. by total annual return. The universe of stocks is selected from any stock that is listed on the NYSE, the AMEX, the NASDAQ, or the ARCA. Also, we exclude stocks that began the year at a price below $2 in order to be consistent with the WSJ annual ranking.
2. Pick the top 10 stocks and the bottom 10 stocks. Call this the winner and loser portfolio.
3. Equal weight both portfolios and compute their subsequent returns 1, 3, 6, and 12 months later.
4. We rebalance the portfolio at the end of the year. For companies that go bankrupt, are bought out, or are delisted for some other reason, we compute the return as the return to the last traded price before being delisted.
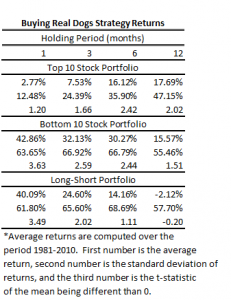
We then compute the subsequent returns for this strategy had you held the portfolio for 1, 3, 6, or 12 months. The average returns from 1981 to 2010 for the top 10 portfolio, bottom 10 portfolio, and a portfolio that shorts the top 10 and goes long the bottom 10 is shown below. This strategy historically produced an average return of 40% in the first month, 25% in the next 3 months, and 14% over the next 6 months.
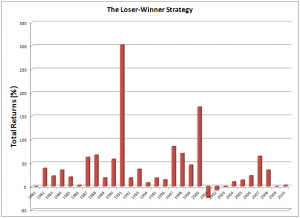
That is great, but you might worry that the volatility is very high. Actually, the measured standard deviation is quite high, but the returns are quite positively skewed and if a downside risk measure were used, it wouldn’t seem that risky. Below a table shows the monthly historical graph of the year-by-year returns for the first month of the new year.
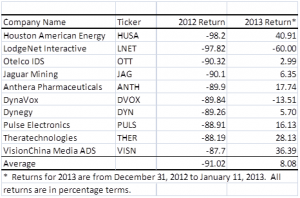
An interesting strategy that seems to have worked well in the past. Just remember though, the strategy has risk and the past may not indicate what will happen in the future. Just in case you were curious, here are the losers for 2012.


